Variant Modeller
| VarMod Variant Modeller |
|
Modelling functional effects of non-synonymous variants |
|
Help |
| This page explains how to use VarMod with details on the submission options and how the results page should be interpreted. If you would like further details about the methods used see the About page. Multiple examples of output from VarMod can be viewed on the Examples page. |
|
Submission Options |
A number of inputs are required to run VarMod. They are:
The protein sequence should be submitted in fasta format: or just the amino acid code: The single nucleotdie variants being investigated must be submitted in the following format: Additionally it is useful to submit the UniProt identifier of query sequence. This is necessary to perform the Protein-Protein interface analysis. |
 |
|
Interpreting VarMod Results |
| Summary of VarMod Predictions | |
| VarMod runs multiple sequence and structural analyses, which are combined to make an overall prediction. Further details of how the data from the different processes are combined can be found in About. The results page initially provides the main prediction with indicators of the features relevant to the prediction full here |
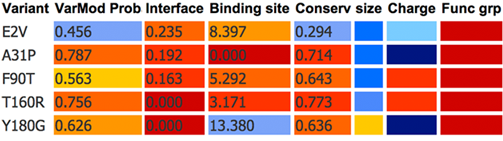
Results Summary Table The results table displays the VarMod prediction for each of the varaiants along with a summary of the main features that VarMod has considered. There are columns are colour coded to indicate their relevance in range from red to blue with red indicating that the variant is likely to have an effect upon protein function and blue that the variant is likely not to affect protein function. Teh columns contain the following data:
|
 |
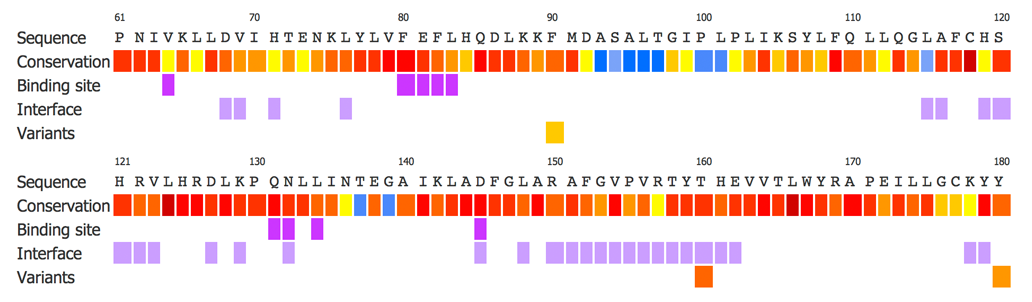
Sequence Conservation View The sequence conservation view displays the query protein sequence colour coded according the residue level conservation, which is calculated using Jensen Shannon divergence. A column below highlights each of the variants within the sequences. This enables the user to investigate the conservation in the region in which the variants are located. |
 |
Structural model view The structural model view provides a JSmol viewer for the user to view a model of the protein with both functional residues (ligand binding and interface sites) and the variant residues mapped onto it. This enables the user to investigate the structural environment of each of the variants and its proximity to functional residues. By default the protein is coloured grey, interface residues blue, ligand binding residues purple and variant residues red. The control panel to the right enables the user to modify the display. |
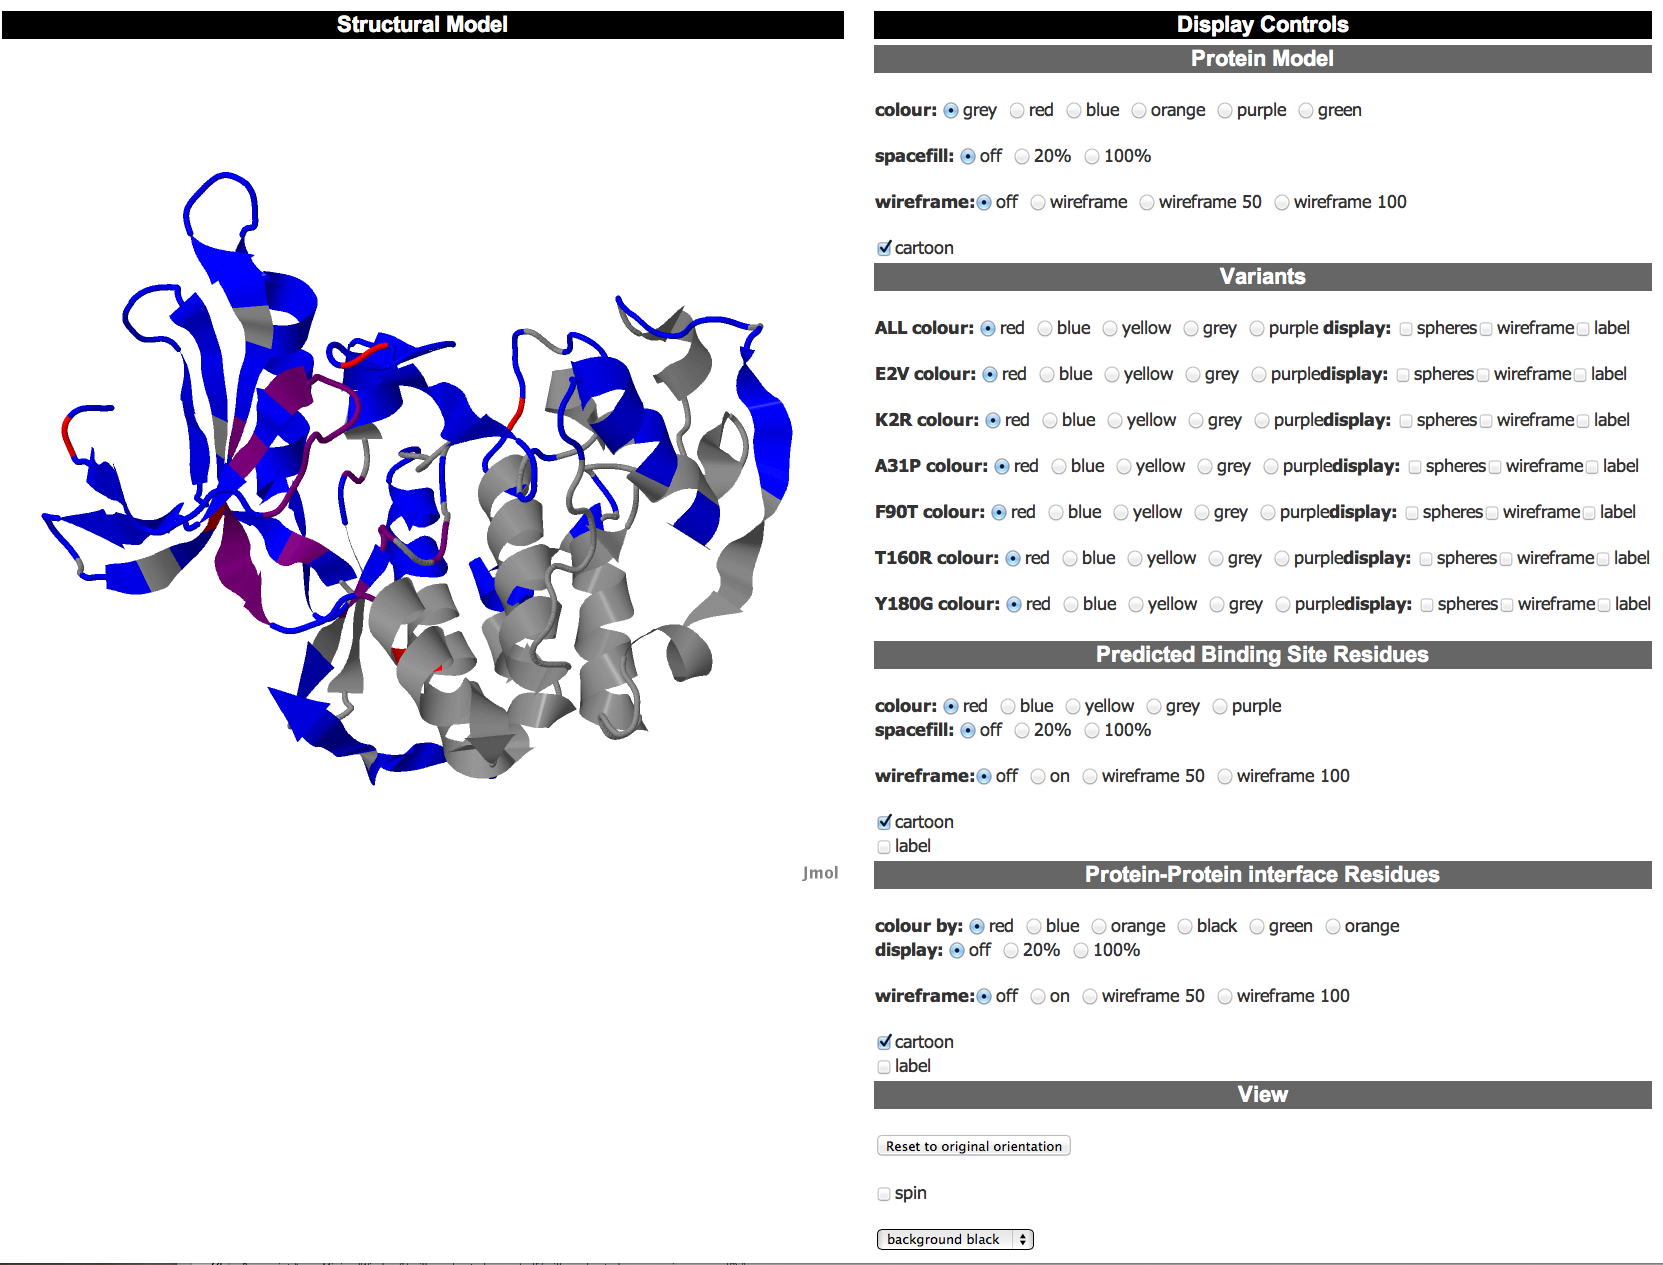 |
Control Panel The control panel is split into multiple sections to enable the user to modify the display of the protein and investigate the variant and functional residues.Basic Protein Controls These controls enable the user to modify the display of the whole protein. There are options to modify the colour of the protein and the display of the structure, which offers spacefill, wireframe or cartoon (default) options. Note that using these controls will modify ALL of the protein residues including the variants and functional residues. However, the user can then adjust these residues as they wish using the other sets of controls. |
 |
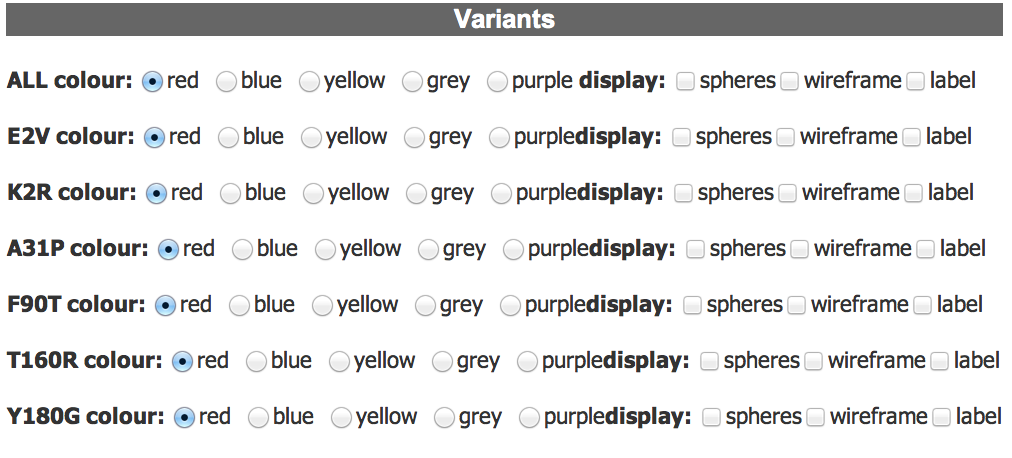
Variant Controls The variant controls enable the user to modify the display of the variant residue positions. The top row of options modify ALL of the variant positions in the protein. This is followed by a row of controls for each of the individual variants. Options here allow the user to modify the colour and disaply of the variants with the same options as for the whole protein. . All variant positions are coloured red by default. |
 |
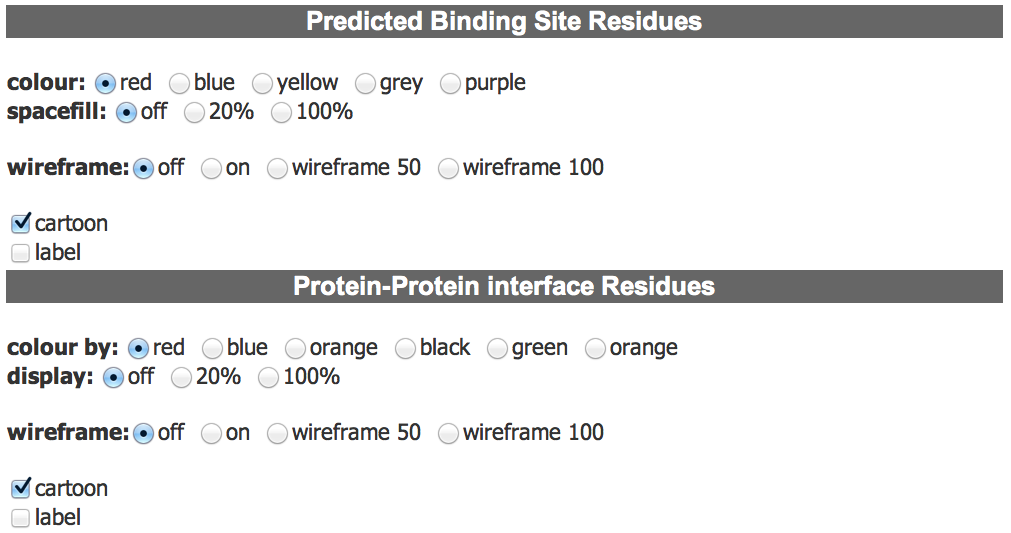
Functional Residue Controls The functional residue controls enable the user to modify the display of the ligand binding site and interface residues. There are separate controls for each of these, which allow the user to modifiy the colour and display of these residues. |
 |
| © Computational Biology Group, University of Kent, UK |
| Mark Wass |